Tutorial 2: Aggregation to Precipitation Sums
This tutorial will show you, how to calculate precipitation sums from the data stored in HDF5 and how to export the results to ArcGIS.
To import your RADOLAN data into the necessary HDF5 file, please follow the tutorial on raw data processing.
Example 1: Annual Precipitation Sums
In this example, the annual precipitation sums for the time period from 2001 to 2016 are calculated and exported to ArcGIS.
1. Import radproc
In [1]:
import radproc as rp
2. Load Data from HDF5 and Aggregate to Annual Precipitation Sums
The following function loads precipitation data of the specified time period (2001-2016) from an HDF5 file and generates a DataFrame with annual precipitation sums for every raster cell.
In [2]:
HDF = r"O:\Data\RW_2001_2016.h5"

annualSum = rp.hdf5_to_years(HDFFile=HDF, year_start=2001, year_end=2016)
# Display the first five rows of the new DataFrame
annualSum.head()
Out[2]:
| Rasterzellen-ID | 427005 | 427006 | 427903 | 427904 | 427905 | 427906 | 428803 | 428804 | 428805 | 428806 | ... | 661855 | 661856 | 661857 | 662752 | 662753 | 662754 | 662755 | 662756 | 663652 | 663655 |
|---|---|---|---|---|---|---|---|---|---|---|---|---|---|---|---|---|---|---|---|---|---|
| Datum (UTC) | |||||||||||||||||||||
| 2001-12-31 00:00:00+00:00 | 783.400024 | 809.500000 | 763.299988 | 773.500000 | 779.700012 | 788.500000 | 769.500000 | 780.400024 | 778.700012 | 783.000000 | ... | 1066.599976 | 1098.699951 | 1125.400024 | 994.000000 | 998.700012 | 1020.599976 | 1056.099976 | 1075.200073 | 989.200012 | 1039.500000 |
| 2002-12-31 00:00:00+00:00 | 967.700012 | 980.799988 | 951.000000 | 935.500000 | 947.200012 | 950.700012 | 956.000000 | 960.700012 | 938.700012 | 955.400024 | ... | 1491.599976 | 1529.500000 | 1539.199951 | 1383.099976 | 1387.500000 | 1407.400024 | 1478.099976 | 1488.800049 | 1380.400024 | 1467.099976 |
| 2003-12-31 00:00:00+00:00 | 597.200012 | 614.200012 | 578.000000 | 583.000000 | 592.200012 | 592.299988 | 573.400024 | 587.700012 | 587.299988 | 589.600037 | ... | 697.600037 | 696.099976 | 683.700012 | 670.400024 | 652.599976 | 638.400024 | 663.599976 | 668.599976 | 663.099976 | 648.000000 |
| 2004-12-31 00:00:00+00:00 | 795.000000 | 801.000000 | 772.000000 | 768.099976 | 776.600037 | 792.799988 | 746.500000 | 767.099976 | 779.000000 | 792.900024 | ... | 851.599976 | 872.200012 | 869.799988 | 803.000000 | 802.000000 | 804.099976 | 825.099976 | 841.599976 | 806.000000 | 813.700012 |
| 2005-12-31 00:00:00+00:00 | 728.099976 | 710.799988 | 678.500000 | 676.799988 | 730.200012 | 681.399963 | 671.400024 | 664.099976 | 658.799988 | 666.299988 | ... | 914.799988 | 922.900024 | 911.099976 | 847.799988 | 861.500000 | 868.099976 | 893.200012 | 903.299988 | 850.799988 | 872.500000 |
5 rows × 23320 columns
Note: All of radproc’s aggregation functions are intended for analysis of longer time periods and currently only work for entire years starting in January! To resample smaller time periods, you can e.g. import and resample months with
May2016 = rp.load_months_from_hdf5(HDFFile=HDF, year=2016,  months=[5])
freq = 'M' # 'M' for monthly sums, 'D' for daily sums, 'H' for hourly sums
monthSum = May2016.resample(frequency=freq, closed = 'right', label = 'right').sum()
3. Export Results into ArcGIS Geodatabase
The following function exports all rows from the DataFrame calculated above into raster datasets in an ArcGIS File Geodatabase. Optionally, different statistics rasters can be created, e.g. the mean or the maximum value of each cell.
In [3]:
idRaster = r"O:\Data\idras"
outGDBPath = r"O:\Data"
GDBName = "Years_01_16.gdb"
statistics = ["mean", "max"]

rp.export_dfrows_to_gdb(dataDF=annualSum, idRaster=idRaster, outGDBPath=outGDBPath, GDBName=GDBName, statistics=statistics)
The resulting geodatabase will look like this in ArcGIS:
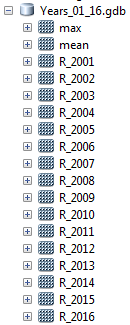
YearGDB
Example 2: Monthly Precipitation Sums
In this example, the monthly precipitation sums for the year 2016 are calculated and exported to ArcGIS.
1. Import radproc
In [4]:
import radproc as rp
2. Load Data from HDF5 and Aggregate to Monthly Precipitation Sums
The following function loads precipitation data of the year 2016 from your HDF5 file and generates a DataFrame with monthly precipitation sums for every raster cell.
In [5]:
HDF = r"O:\Data\RW_2001_2016.h5"

monthlySum = rp.hdf5_to_months(HDFFile=HDF, year_start=2016, year_end=2016)
# Display the first five rows of the new DataFrame
monthlySum.head()
Out[5]:
| Rasterzellen-ID | 427005 | 427006 | 427903 | 427904 | 427905 | 427906 | 428803 | 428804 | 428805 | 428806 | ... | 661855 | 661856 | 661857 | 662752 | 662753 | 662754 | 662755 | 662756 | 663652 | 663655 |
|---|---|---|---|---|---|---|---|---|---|---|---|---|---|---|---|---|---|---|---|---|---|
| Datum (UTC) | |||||||||||||||||||||
| 2016-01-31 00:00:00+00:00 | 71.400002 | 71.900002 | 68.000000 | 69.099998 | 70.099998 | 71.699997 | 65.500000 | 67.300003 | 66.199997 | 69.800003 | ... | 128.199997 | 129.500000 | 129.600006 | 120.199997 | 121.300003 | 123.500000 | 125.699997 | 122.900002 | 118.099998 | 120.400002 |
| 2016-02-29 00:00:00+00:00 | 68.699997 | 71.199997 | 61.500000 | 64.300003 | 67.300003 | 68.400002 | 58.200001 | 61.700001 | 65.000000 | 64.300003 | ... | 105.900002 | 106.199997 | 110.099998 | 96.800003 | 96.699997 | 100.099998 | 102.599998 | 101.400002 | 92.800003 | 97.400002 |
| 2016-03-31 00:00:00+00:00 | 41.799999 | 41.299999 | 40.299999 | 39.900002 | 40.099998 | 39.299999 | 37.700001 | 38.200001 | 38.799999 | 37.500000 | ... | 65.500000 | 64.400002 | 65.199997 | 70.000000 | 67.500000 | 64.400002 | 65.099998 | 65.099998 | 69.800003 | 65.500000 |
| 2016-04-30 00:00:00+00:00 | 55.700001 | 56.600002 | 51.799999 | 52.400002 | 54.000000 | 55.299999 | 50.799999 | 51.200001 | 52.799999 | 54.400002 | ... | 108.500000 | 112.199997 | 115.400002 | 106.700005 | 106.500000 | 107.699997 | 112.599998 | 114.300003 | 105.199997 | 108.099998 |
| 2016-05-31 00:00:00+00:00 | 38.200001 | 40.600002 | 47.299999 | 44.799999 | 39.400002 | 34.299999 | 46.799999 | 45.400002 | 43.200001 | 38.500000 | ... | 121.299995 | 119.300003 | 115.099998 | 128.100006 | 138.199997 | 135.500000 | 124.300003 | 128.500000 | 130.199997 | 134.399994 |
5 rows × 23320 columns
3. Export Results into ArcGIS Geodatabase
The following function exports all rows from the DataFrame calculated above into raster datasets in an ArcGIS File Geodatabase. Optionally, different statistics rasters can be created, in this case the mean, maximum and minimum value of each cell as well as the range per cell.
In [6]:
idRaster = r"O:\Data\idras"
outGDBPath = r"O:\Data"
GDBName = "Months_16.gdb"
statistics = ["mean", "max", "min", "range"]

rp.export_dfrows_to_gdb(dataDF=monthlySum, idRaster=idRaster, outGDBPath=outGDBPath, GDBName=GDBName, statistics=statistics)
The resulting geodatabase will look like this in ArcGIS:
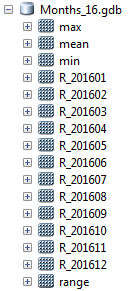
MonthGDB