Tutorial 3: Heavy Rainfall Analysis
This tutorial shows how to identify and count heavy rainfall intervals exceeding a specified threshold and export the results to ArcGIS.
Example 1: Identification of Heavy Rainfall Intervals
1. Import radproc
In [1]:
import radproc as rp
2. Identify Heavy Rainfall Intervals
To identify and select all intervals exceeding a rainfall threshold x at least y times in season z, you can use the function
find_heavy_rainfalls(HDFFile, year_start, year_end, thresholdValue, minArea, season)
The following code will extract all intervals, in which an hourly precipitation of 30 mm is exceeded in at least five cells (these don’t need to be adjacent cells!) in May 2016 in Hesse.
In [2]:
HDF = r"O:\Data\RW.h5"

hr = rp.find_heavy_rainfalls(HDFFile=HDF, year_start=2016, year_end=2016, thresholdValue=30, minArea=5, season='May')
hr
Out[2]:
| Cell-ID | 427005 | 427006 | 427903 | 427904 | 427905 | 427906 | 428803 | 428804 | 428805 | 428806 | ... | 661855 | 661856 | 661857 | 662752 | 662753 | 662754 | 662755 | 662756 | 663652 | 663655 |
|---|---|---|---|---|---|---|---|---|---|---|---|---|---|---|---|---|---|---|---|---|---|
| Date (UTC) | |||||||||||||||||||||
| 2016-05-27 16:50:00+00:00 | 0.0 | 0.0 | 0.0 | 0.0 | 0.0 | 0.0 | 0.0 | 0.0 | 0.0 | 0.0 | ... | 0.0 | 0.0 | 0.0 | 0.0 | 0.0 | 0.0 | 0.0 | 0.0 | 0.0 | 0.0 |
| 2016-05-27 17:50:00+00:00 | 0.0 | 0.0 | 0.0 | 0.0 | 0.0 | 0.0 | 0.0 | 0.0 | 0.0 | 0.0 | ... | 0.0 | 0.0 | 0.0 | 0.0 | 0.0 | 0.0 | 0.0 | 0.0 | 0.0 | 0.0 |
| 2016-05-28 14:50:00+00:00 | 0.0 | 0.0 | 0.1 | 0.1 | 0.0 | 0.0 | 0.0 | 0.1 | 0.1 | 0.0 | ... | 0.1 | 0.9 | 1.7 | 0.4 | 0.5 | 0.5 | 0.6 | 1.1 | 0.7 | 0.6 |
| 2016-05-28 15:50:00+00:00 | 1.2 | 1.1 | 1.3 | 1.2 | 1.1 | 1.1 | 1.4 | 1.1 | 1.3 | 1.2 | ... | 4.7 | 4.0 | 4.3 | 9.2 | 7.8 | 6.3 | 3.8 | 3.4 | 10.6 | 3.9 |
| 2016-05-28 17:50:00+00:00 | 0.0 | 0.0 | 0.0 | 0.0 | 0.0 | 0.0 | 0.0 | 0.0 | 0.0 | 0.0 | ... | 4.2 | 4.4 | 4.3 | 4.5 | 5.1 | 4.5 | 4.7 | 4.3 | 5.3 | 5.2 |
| 2016-05-29 16:50:00+00:00 | 0.0 | 0.0 | 0.0 | 0.0 | 0.0 | 0.0 | 0.0 | 0.0 | 0.0 | 0.0 | ... | 0.0 | 0.0 | 0.0 | 0.0 | 0.0 | 0.0 | 0.0 | 0.0 | 0.0 | 0.0 |
| 2016-05-29 23:50:00+00:00 | 0.0 | 0.2 | 0.3 | 0.2 | 0.2 | 0.1 | 0.2 | 0.1 | 0.0 | 0.2 | ... | 4.9 | 3.9 | 4.0 | 4.3 | 4.4 | 4.2 | 4.2 | 3.4 | 4.3 | 3.8 |
| 2016-05-30 00:50:00+00:00 | 0.0 | 0.0 | 0.0 | 0.0 | 0.0 | 0.0 | 0.0 | 0.0 | 0.0 | 0.0 | ... | 4.5 | 3.8 | 3.5 | 3.7 | 3.5 | 4.2 | 4.1 | 3.6 | 4.0 | 3.6 |
8 rows × 23320 columns
3. Export Results into ArcGIS Geodatabase
The following function exports all rows from the resampled daily DataFrame calculated above into raster datasets in an ArcGIS File Geodatabase. Optionally, different statistics rasters can be created, in this case the sum and the maximum value of each cell.
In [3]:
idRaster = r"O:\Data\idras"
outGDBPath = r"O:\Data"
GDBName = "May16_30mm5c.gdb"
statistics = ["sum", "max"]

rp.export_dfrows_to_gdb(dataDF=hr, idRaster=idRaster, outGDBPath=outGDBPath, GDBName=GDBName, statistics=statistics)
The new Geodatabase looks like this in ArcGIS:
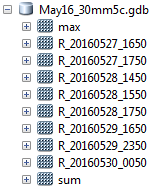
HR_GDB
Side Note In this example, eight intervals meeting the given criteria have been identified at four days. The following code can be used as a simple approach to obtain daily sums for these events. (Of course this does not take into account that the interval at May 30th is most likely part of the same precipitation event as the ones from May 29th…this is a more complicated topic to be adressed in future versions of radproc)
In [4]:
hr_daily = hr.resample('D').sum()
hr_daily
Out[4]:
| Cell-ID | 427005 | 427006 | 427903 | 427904 | 427905 | 427906 | 428803 | 428804 | 428805 | 428806 | ... | 661855 | 661856 | 661857 | 662752 | 662753 | 662754 | 662755 | 662756 | 663652 | 663655 |
|---|---|---|---|---|---|---|---|---|---|---|---|---|---|---|---|---|---|---|---|---|---|
| Date (UTC) | |||||||||||||||||||||
| 2016-05-27 00:00:00+00:00 | 0.0 | 0.0 | 0.0 | 0.0 | 0.0 | 0.0 | 0.0 | 0.0 | 0.0 | 0.0 | ... | 0.0 | 0.0 | 0.0 | 0.000000 | 0.0 | 0.0 | 0.000000 | 0.0 | 0.0 | 0.0 |
| 2016-05-28 00:00:00+00:00 | 1.2 | 1.1 | 1.4 | 1.3 | 1.1 | 1.1 | 1.4 | 1.2 | 1.4 | 1.2 | ... | 9.0 | 9.3 | 10.3 | 14.099999 | 13.4 | 11.3 | 9.099999 | 8.8 | 16.6 | 9.7 |
| 2016-05-29 00:00:00+00:00 | 0.0 | 0.2 | 0.3 | 0.2 | 0.2 | 0.1 | 0.2 | 0.1 | 0.0 | 0.2 | ... | 4.9 | 3.9 | 4.0 | 4.300000 | 4.4 | 4.2 | 4.200000 | 3.4 | 4.3 | 3.8 |
| 2016-05-30 00:00:00+00:00 | 0.0 | 0.0 | 0.0 | 0.0 | 0.0 | 0.0 | 0.0 | 0.0 | 0.0 | 0.0 | ... | 4.5 | 3.8 | 3.5 | 3.700000 | 3.5 | 4.2 | 4.100000 | 3.6 | 4.0 | 3.6 |
4 rows × 23320 columns
For example, the resulting raster dataset for the sum of the two intervals on May 27th looks like this:
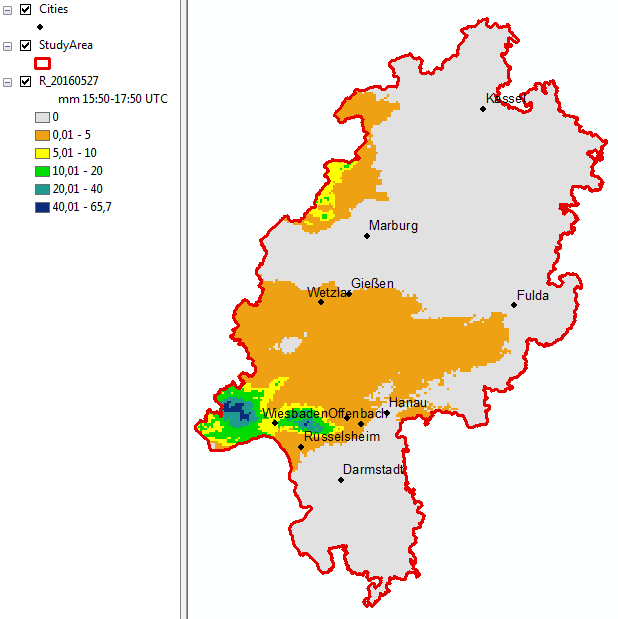
HR_20160527
Example 2: Counting Heavy Rainfall Intervals
1. Identify and Count Heavy Rainfall Intervals
To count the number of times in which a rainfall threshold x is exceeded at every cell in season z, you can use the function
count_heavy_rainfall_intervals(HDFFile, year_start, year_end, thresholdValue, minArea, season)
If you specify a minimum area a > 1, only intervals in which the threshold x is exceeded in at least y cells are taken into account.
The following code will count how many times an hourly precipitation of 10 mm is exceeded at every cell in May 2016 in Hesse.
In [5]:
HDF = r"O:\Data\RW.h5"

hr_count = rp.count_heavy_rainfall_intervals(HDFFile=HDF, year_start=2016, year_end=2016, thresholdValue=10, minArea=1, season='May')
hr_count
Out[5]:
| Cell-ID | 427005 | 427006 | 427903 | 427904 | 427905 | 427906 | 428803 | 428804 | 428805 | 428806 | ... | 661855 | 661856 | 661857 | 662752 | 662753 | 662754 | 662755 | 662756 | 663652 | 663655 |
|---|---|---|---|---|---|---|---|---|---|---|---|---|---|---|---|---|---|---|---|---|---|
| Date (UTC) | |||||||||||||||||||||
| 2016-05-31 00:00:00+00:00 | 0 | 0 | 0 | 0 | 0 | 0 | 0 | 0 | 0 | 0 | ... | 1 | 1 | 0 | 1 | 1 | 1 | 1 | 1 | 2 | 1 |
1 rows × 23320 columns
In [6]:
# print the maximum value
hr_count.max(axis=1)
Out[6]:
Date (UTC)
2016-05-31 00:00:00+00:00    4
Freq: M, dtype: int32
2. Export to Raster
As the output DataFrame only has one row (because we only analyzed one month), it can be exported directly with
export_to_raster(series, idRaster, outRaster)
In [7]:
rp.export_to_raster(series=hr_count, idRaster=r"O:\Data\idras", outRaster=r"O:\Data\hrcount10mm")
Out[7]:
'O:\\Data\\hrcount10mm'